Load Test
Simple performance test to determine the overall event throughput for an ORION server on a particular hardware platform.
Download example - Already included in recent ORION packages
DESCRIPTION
There is only one way to determine accurate and relevant performance numbers for complex event processing systems – that is you run your production application on your production hardware. Given a specific hardware configuration, the performance depends on the throughput of input protocols, as well as the tasks performed on each event within the filters, which can vary greatly. However, sometimes it helps to know what throughput a hardware platform is capable of. This question is answered by the Load Test application. It generates as many events as possible, injects them into ORION, counts them in a Filter Stack, and releases easy to understand summary statistics for every 10,000 input events.
EXPLANATION
The performance of an event processing server can only be considered in the context of the application running on it and its underlying hardware. However, it helps to know the overall magnitude of events that can be transacted through the architecture.
This application provides you with an effective tool to compare high-level throughput on different hardware platforms. It also provides you with some simple components that will help you to measure and optimize the performance of your actual production applications.
These are some sample performance metrics obtained with this Load Test application:
| Events Per Second | CPU Utilization | System Configuration |
|---|---|---|
| 163,800 | 60-65% | Dual Intel XEON 2.4 GHz Processors, 512mb RAM, Redhat Enterprise ES 3.0, ORION 6.0 Build 2076 |
| 138,600 | 55% (MacOS) | Windows XP emulated under Parallels (like VMWare) with 256mb RAM setting, running on an Intel Core Duo 2 GHz MacBook Pro Mac OS X 10.4, ORION 6.0 Build 2076 |
The Flood Source is a special source that generates as many events as the system is able to process. The events consist of four fields Host, Application, Log, and Message. The Flood Source can be used for many load generating test applications, and is not only limited to this example. Many hosts with Flood Sources forwarding events on a particular outbound protocol can be used to generate event loads for testing larger servers, as it can often be difficult to generate sufficient transactions loads to exercise high-performance hardware platforms.
The Diagnostic Count Event Filter receives events and creates summary statistics based on its input event stream. In this configuration, the Diagnostic Count Event Filter will issues one summary event for every 10,000 input events received. The raw input events will not be forwarded.
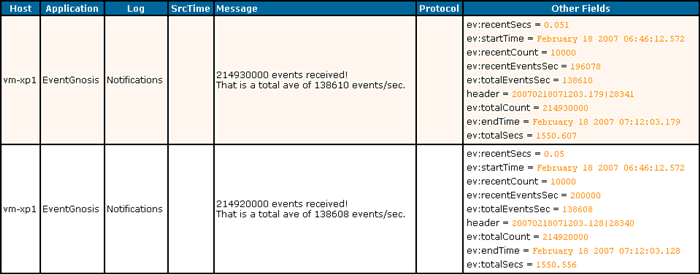
In this application, all summary events are written into the “defaultArchive” which can be viewed in the Event Viewer.
As you can see, the event messages describe the total number of events processed since the start of the process, and the average number of events per second processed, since that start time.
In addition, the right-most column “Other Fields” shows additional fields generated by the Diagnostic Count Event Filter in the summary events. Here are their meanings:
| Field Name | Value | Description |
|---|---|---|
| ev:startTime | February 18 2007, 06:46:12.572 | The start date of the process when the filter initialized |
| ev:endTime | February 18 2007, 7:12:03.179 | The current time at which the summary event was generated |
| ev:totalSecs | 1550.607 | The endTime minus startTime in seconds, which is just under 26 minutes total run-time |
| ev:totalCount | 214,930,000 | Total number of events processed during that time |
| ev:totalEventsSec | 138,610 | The average events per second over the total running time |
| ev:recentCount | 10,000 | The number of events in the most recent summary frame (which is the number configured in the filter) |
| ev:recentSecs | 0.051 | Number of seconds during with the last 10,000 events very received |
| ev:recentEventsSec | 196,076 | The instantaneous rate over events received (over the last 0.051 secs) in events per second. 196,076 = 10,000/0.051 (Note: This number can fluctuate widely!) |
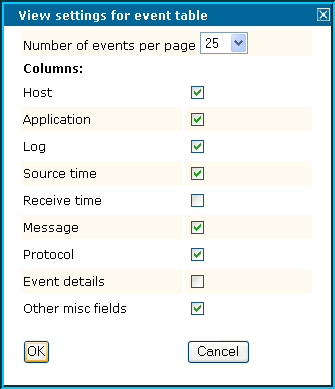
Note: In order to see the column “Other Fields”, click on “View” and check mark the entry “Other misc fields”, as show below:
HOW TO RUN THE EXAMPLE
In order to accurately compare hardware platforms make sure of the following:
- Run with a Trial License or with an Unlimited License: You will exceed any licensed performance limits, and there is processing overhead on each excess event. This could reduce the throughput by as much as 60%. Ask us for an additional Trial License if you need one for testing.
- Close all unnecessary Applications/Services: This will definitely affect your numbers.
- Turn Auto-Update OFF in the Event Viewer: Use the Goto End button instead.
- Let the Load Test run for at least 5-10 minutes until the average has reached its maximum: The cumulative average includes initialization time. You will see the average rising over time until it flattens out.
Additional Ideas
- Insert the Diagnostic Count Events Filter into your own applications at critical points to measure the number of events arriving at that point.
Please note: Only the summary events will pass!
- In an application of your own, create a “LoadProbe-Stack” and place a Diagnostic Count Event Filter into it, and point its Standard Output to an archive writer. Next, place a Copy Event Filter into critical parts of your application which copies all events to the “LoadProbe-Stack”. This will give you a fairly good measure of event throughputs at various points of your application, which allows diagnosing bottlenecks and choke points in the applications that you might want to design around.
Please note: The Copy Event Filter will take itself some CPU cycles, so it will artificially reduce the throughput volume especially with light-weight applications that mostly stream events through with minimal processing per event.
INSTALLATION
Follow the standard installation procedure for examples.
KEY SKILLS DEMONSTRATED
- Generating test event traffic with the Flood Source
- Using performance probes with the Diagnostic Count Event Filter
- Event Viewer: Displaying Event Details
FILES
- EV_HOME/config/LoadTest.xml - Generates events, calculates throughput statistics, and writes to the Event Viewer.
INPUT PROTOCOLS
OUTPUT PROTOCOLS
SUMMARY
COMPLEXITY: BASIC
ORION VERSION: 6.0
KEY WORDS: PERFORMANCE, LOAD, DIAGNOSITICS, Flood Source, Diagnostic Count Event Filter, Event Viewer


